Welcome to
Eco Agri Analytics
Dive in and enjoy the journey to explore
the connections between data, food and agriculture
Dive in and enjoy the journey to explore
the connections between data, food and agriculture

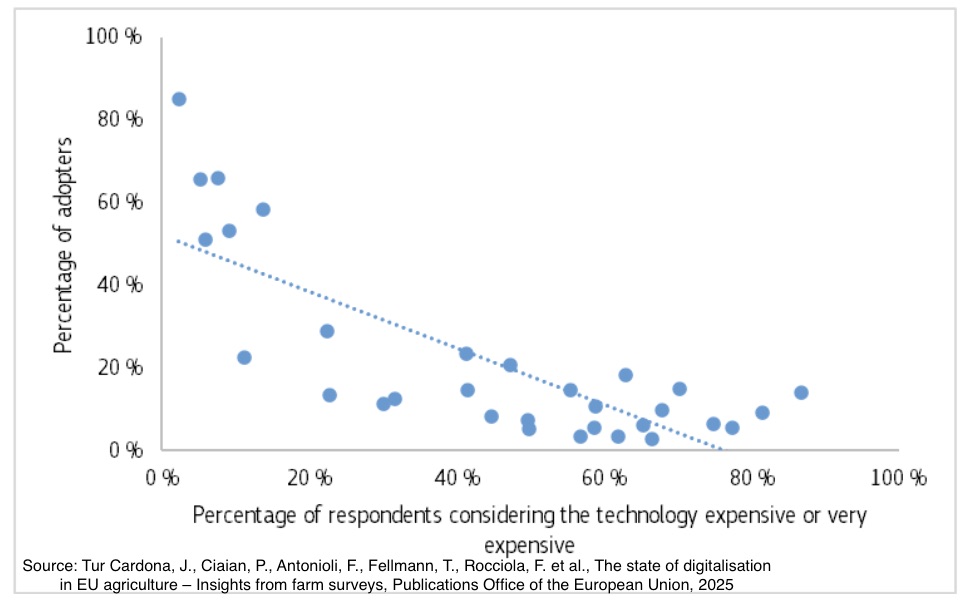
Recent survey data indicate that advanced digital livestock technologies are widely perceived as prohibitively expensive, constraining adoption rates. While farm management software is predominantly self-financed, capital‑intensive crop and livestock systems rely heavily on external funding sources. This asymmetry presents a clear opportunity for financial institutions to develop targeted credit and leasing products, accelerating the uptake of digital tools and narrowing the technological divide in European agriculture.

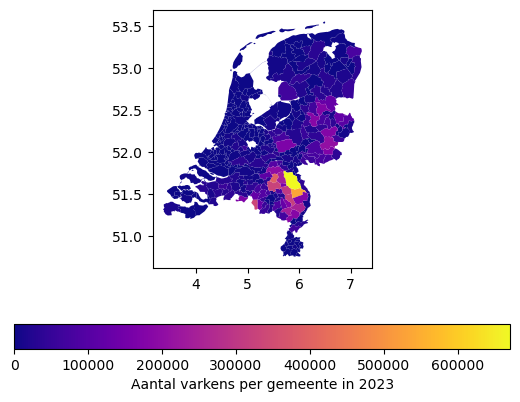
Mapping livestock density at the municipal level reveals a striking concentration of pig production. This spatial clustering underscores the economic specialization of the region and the structural exposure to regulatory, environmental, and market risks. For policymakers and investors alike, this highlights the importance of region‑specific strategies in managing sustainability and resilience within Dutch livestock production.

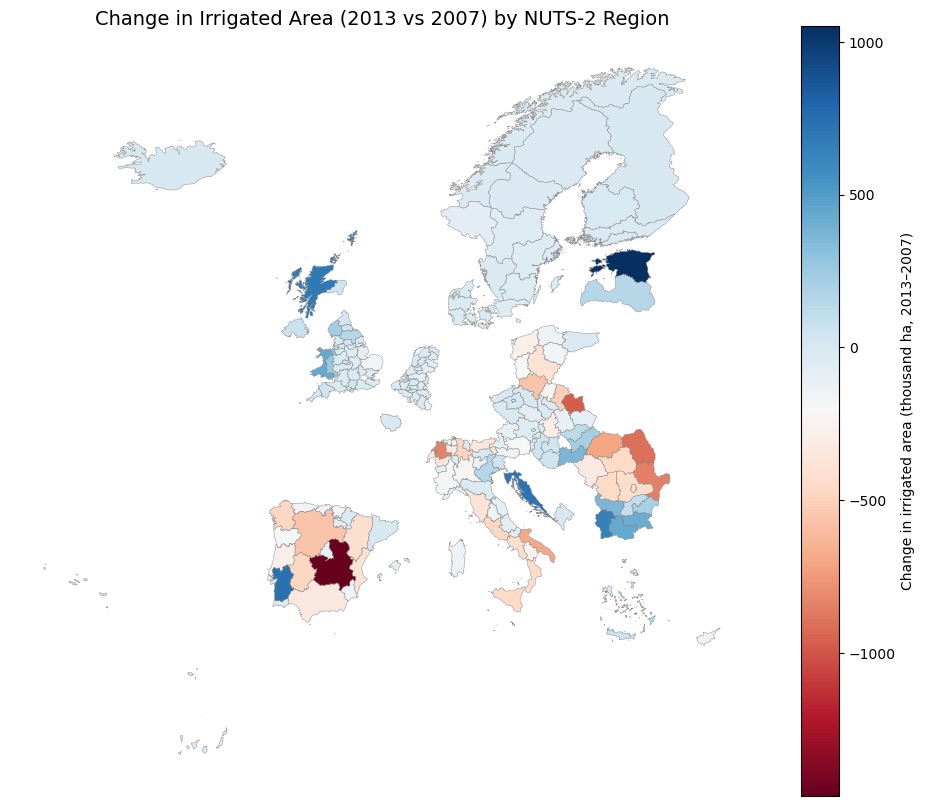
Between 2007 and 2013, irrigated land shrank in Spain, Italy and Romania, while Bulgaria and parts of Northern Europe expanded. These swings show how climate and farming choices are already reshaping water use. Europe needs sharper data and research on irrigation to guide sustainable water policy in the years ahead.

The diagram reveals Europe’s hidden role as shock absorber in global soy trade. This dependency undermines sustainability goals. Reliance on imported soy protein locks Europe into deforestation‑linked supply chains, challenging its climate and biodiversity commitments. Invest in and diversify protein sources to reduce systemic risk in EU feed chains.

Donec eget ex magna. Interdum et malesuada fames ac ante ipsum primis in faucibus. Pellentesque venenatis dolor imperdiet dolor mattis sagittis magna etiam.

Donec eget ex magna. Interdum et malesuada fames ac ante ipsum primis in faucibus. Pellentesque venenatis dolor imperdiet dolor mattis sagittis magna etiam.